
Most email software will provide in depth reporting and analysis of email performance. But sometimes, especially if you don’t have access to (or even understand) those reports, it’s handy to be able to quickly find out how your email marketing is working on Google Analytics.
Look at Email as a Channel
Once you’ve logged into Analytics, pick a suitable timeframe that you’re interested in and then, using the menu on the left, scroll down to Acquisition, and click on All Traffic > Channels.
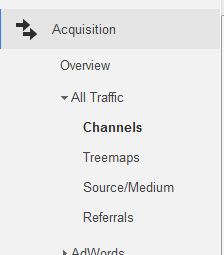
In the main window, you will now see information separated out between all of the different standard Google Analytics channels. Interesting on its own merits I’m sure, but here you will see just how dependent you are on individual types of activity as well as opportunities for additional reach.
To drill down to just Email’s though, click on Email under Default Channel Grouping and lo and behold, we’ve filtered out all other traffic sources. (We didn’t say this was hard btw)
Tweak The Data
What you will likely be looking at now, are the pages that received the most traffic from your emails. This is often useful, but for the purposes of this exercise we want to see how each email performance, rather than which pages have received the most traffic.
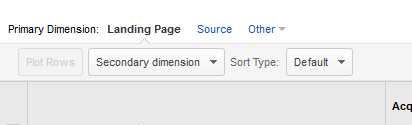
Across the middle(ish) of the page is the Primary Dimension that we are looking at – probably set to Landing Page. Click on other, and type in and select Campaign. This should now group your information into individual campaigns – ideally, these should be named in an understandable way, allowing you to easily see which of your email have performed the best.
A campaign is usually set during the sending of each individual email. It basically works by appending information to the end links contained in your emails– you don’t need to know how that works, but it’s widely used all over the web for nerds (like us) to understand how users behave.
Rank & Compare
What you can know do is use the filters in Analytics to look at your date in different ways. By clicking on the checkbox and then “Plot Rows” you can see visually in the chart how those selected campaigns have performed.
You can also click on the column headers, to rank the data accordingly. Which emails sent the most traffic (you have to bear in mind the size of the send of course) and which emails generated most sales.

The trick is not to just consider absolute numbers. An email may not always convert directly (Multi-channel attribution is a big topic!) so what we’re most interested in is comparisons. Which emails you’ve sent have performed better? Take a look back on those mail shots – what was it about them that you can attribute to success/failure.
Why did X do better than Y. Is it the message, the offer, the timing etc. Was it a seasonal product? If so, should you do the same next year. This type of critical thinking will help you determine how to improve in the future. It means that even emails that bomb, are useful as they help you to adapt your future messaging/strategy.